
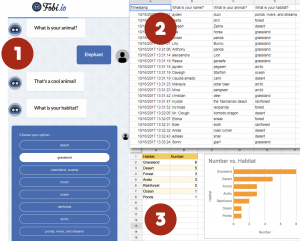
 We’re on an animal habitats streak here! In previous posts I’ve shown how your habitats unit (SOL3.4) can reinforce the skills you are teaching in Social Studies and Reading. Now we’ll see how it can reinforce Math concepts as well. At Trevvett Elementary, third graders have been learning about graphing (3.17), so today students in Ms. Bae’s class practiced graphing animal’s habitats. First we had to collect some data. I used Fobio to convert a Google form into a chatbot to make the process a bit more interesting. You can try the chatbot out for yourself by clicking here. Once the students had entered their information, I took a screenshot of the results spreadsheet and posted it to Schoology (step 2 in the graphic accompanying this post). Next the students opened a blank Google spreadsheet and typed the habitats in Column A and the number of animals in Column B. I showed them how to use the new “Explore” feature by clicking the star shape in the bottom right corner. From the pop-up window they could change the colors of the rows and automatically add a bar graph (step 3 in the graphic). I explained that they could also change the colors of the bars by double clicking on one of them, then clicking the paint bucket in the pop-up window. The students shared the links to their spreadsheets on Schoology. You can see an example here.
3rd Grade Animal Habitats Graph
This entry was posted in 3rd Grade, GoogleDocs, graph, Math, Science, spreadsheet, webtools. Bookmark the permalink.

