
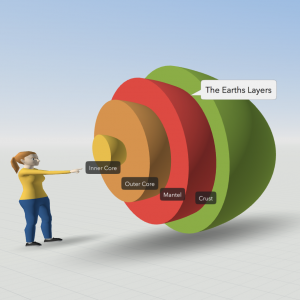
 Fifth graders at Laburnum Elementary have been learning about the layers of the Earth in Science (SOL5.7d), so today students in Ms. Johnson’s class created 3-D models of the Earth using CoSpaces. First, I set up a free classroom account, and the students logged in with a code. Usually, the first thing you do in CoSpaces is click the Environment button at the bottom and chose an environment. We decided to use the default environment for this project to save time. Then, we clicked on Library button and chose the Build tab to find the half-sphere shape. We added that to our scene, and I showed them how to use the pop-up tools to raise the shape and rotate it. Right-clicking on the shape brings up a menu that we used to change the color of the shape. Since this represented the crust, we also added a label using the right-click menu. Then, we duplicated the shape, shrunk it a bit, recolored it, and labeled this new half-sphere as the mantle. Some chose to try to push the shape into the crust, while others left theirs out. The students continued in this way, adding the rest of the layers of the Earth. Finally, we chose a character from the characters library to add to the scene. The characters can be customized and given speech bubbles by right-clicking on them. CoSpaces has a coding component as well, but we didn’t have time to code during this lesson. We shared our projects in Schoology, and you can see some student examples here.
5th Grade 3-D Models of the Earth
2nd Grade Extreme Weather Skip Counting Maps
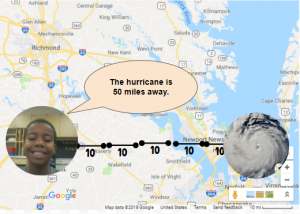 Second graders at Laburnum Elementary have been learning about extreme weather in Science (SOL2.6), skip counting in Math (SOL2.2a), and map skills in History (SOL2.1b). So today, students in Ms. Pope’s class reviewed all three concepts with a Google Drawing project. First, the students decided if they wanted to skip count by 2’s, 5’s, or 10’s, and they chose the corresponding template (you can copy each template by going here). Next, we right-clicked on one image holder and replaced it with a picture of some type of extreme weather (hurricane, tornado, blizzard, flood, etc.) using the “Replace image > Search the web” button. We added our own photo to the other image holder using “Replace image > Camera.” I encouraged the students to look surprised or scared in their photos since the extreme weather was heading their way! Now it was time to practice skip counting. We moved the map scale segments from the bottom to create a line showing the distance from the weather image to our photo. Then we skip counted the segments. Finally, we changed the words inside one of the speech bubbles to say something like, “The weather is ___ miles away.” You can see all their projects here.
3rd Grade Animal Research
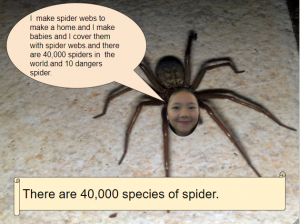 Third graders at Trevvett Elementary have been learning about animal adaptations in Science (SOL3.4) and place value for six-digit numbers in Math (SOL3.1a). Today students in Ms. Hufnell’s class used their research skills to find images and facts about an animal of their choice, including how many exist. This gave us the opportunity to review and read large numbers up to six digits. First, we made copies of a Google drawing template (you can make your own copy here). Then, students clicked the Image button and did a Google image search for their animal. When we added the picture, we noticed that it covered the speech bubble, so I showed them how to click Arrange > Order > Send to back. Next, they clicked the Image button and chose “Webcam.” Each student took a photo of their own face to put in place of the animal’s face. To make it more realistic-looking, we used the cropping tool to make the face into a circle shape. Students typed complete sentences in the speech bubble explaining their animal’s adaptations. Finally, they asked Google: “How many (of my animal) are there?” and they wrote the number in the scroll shape. They could change the color of the speech bubble and scroll with the paint bucket tool when they finished. We shared our projects with each other on Schoology, but you can see them all here.
3rd Grade Animal Research
Third graders at Trevvett Elementary have been learning about animal adaptations in Science (SOL3.4) and place value for six-digit numbers in Math (SOL3.1a). Today students in Ms. Hufnell’s class used their research skills to find images and facts about an animal of their choice, including how many exist. This gave us the opportunity to review and read large numbers up to six digits. First, we made copies of a Google drawing template (you can make your own copy here). Then, students clicked the Image button and did a Google image search for their animal. When we added the picture, we noticed that it covered the speech bubble, so I showed them how to click Arrange > Order > Send to back. Next, they clicked the Image button and chose “Webcam.” Each student took a photo of their own face to put in place of the animal’s face. To make it more realistic-looking, we used the cropping tool to make the face into a circle shape. Students typed complete sentences in the speech bubble explaining their animal’s adaptations. Finally, they asked Google: “How many (of my animal) are there?” and they wrote the number in the scroll shape. They could change the color of the speech bubble and scroll with the paint bucket tool when they finished. We shared our projects with each other on Schoology, but you can see them all here.
5th Grade Hurricane Hypothesis
 Fifth graders at Varina Elementary have been learning about the scientific method: forming a hypothesis, collecting data, taking measurements, graphing information, and analyzing the results (SOL5.1). Since Virginia is currently facing the threat of Hurricane Florence, and since the 5th graders need to review weather (SOL4.6), we decided to research hurricanes using the scientific method. First, I showed them some photos of past hurricanes and identified the eye of the hurricane. If the “eye” is the center, then the “eyelid” can be the area near the eye, and the “eyebrow” can be a bit further out. What part of the hurricane has the strongest winds? We made a copy of this spreadsheet, and I asked the students to write their hypothesis in the purple box. For example: If the distance from the eye increases, the windspeed will increase (or decrease). Now it was time to make some measurements and collect data. We went to Windy and Earth which show live storms on the Earth. You can click anywhere in the storm to get the windspeed (you may need to go to settings to change the units to mph). We used Accuweather or the National Hurricane Center to get the names of the hurricanes. The students could measure the winds in any hurricane they wanted, and I pointed out that the more data they collect, the more reliable their conclusions will be. They recorded the information in their spreadsheet, including the name of the hurricane and the windspeed measured at the eye, eyelid, eyebrow, and maximum (found by just searching around the storm for the biggest number). Finally, I showed them how to graph the data and customize the colors. We analyzed the results to confirm or revise our hypothesis. Most of us discovered that the strongest winds were in the eyebrow area, so as the distance from the eye increased, the windspeed increased. You can take a look at some student samples here. UPDATE: Schools closed the next day, 9/14, due to Hurricane Florence, and on 9/17 we had tornados!
5th Grade Hurricane Hypothesis
Fifth graders at Varina Elementary have been learning about the scientific method: forming a hypothesis, collecting data, taking measurements, graphing information, and analyzing the results (SOL5.1). Since Virginia is currently facing the threat of Hurricane Florence, and since the 5th graders need to review weather (SOL4.6), we decided to research hurricanes using the scientific method. First, I showed them some photos of past hurricanes and identified the eye of the hurricane. If the “eye” is the center, then the “eyelid” can be the area near the eye, and the “eyebrow” can be a bit further out. What part of the hurricane has the strongest winds? We made a copy of this spreadsheet, and I asked the students to write their hypothesis in the purple box. For example: If the distance from the eye increases, the windspeed will increase (or decrease). Now it was time to make some measurements and collect data. We went to Windy and Earth which show live storms on the Earth. You can click anywhere in the storm to get the windspeed (you may need to go to settings to change the units to mph). We used Accuweather or the National Hurricane Center to get the names of the hurricanes. The students could measure the winds in any hurricane they wanted, and I pointed out that the more data they collect, the more reliable their conclusions will be. They recorded the information in their spreadsheet, including the name of the hurricane and the windspeed measured at the eye, eyelid, eyebrow, and maximum (found by just searching around the storm for the biggest number). Finally, I showed them how to graph the data and customize the colors. We analyzed the results to confirm or revise our hypothesis. Most of us discovered that the strongest winds were in the eyebrow area, so as the distance from the eye increased, the windspeed increased. You can take a look at some student samples here. UPDATE: Schools closed the next day, 9/14, due to Hurricane Florence, and on 9/17 we had tornados!
1st Grade Ordinal Numbers
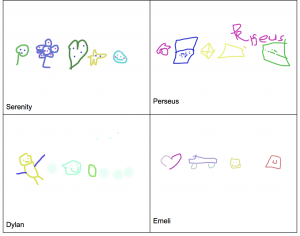 First graders at Laburnum Elementary have been learning about ordinal numbers (SOL1.3). Today, students in Ms. Leibowitz’s class identified the ordinal numbers of objects in a drawing they created. First, we helped the students log into the computers, since they haven’t had much experience with them. Then we went to Kleki, a free drawing site I like because it’s simple to access and use. We started off just scribbling in order to practice using the click and drag technique. This, in itself, is a challenge for young students developing their fine motor skills. Once they got the hang of it, I showed them the Undo button, and we undid all the scribbles. Now it was time to start drawing pictures. I demonstrated how they could change colors using the rainbow. They could draw anything they wanted, as long as the objects were in a row, since we would be identifying their ordinal positions. Some first graders get very concerned if their pictures are not perfect, so I let them know that their pictures could be messy (I did a few messy examples). Even a squiggle could be a snake or a worm. Their drawings could be simple (circles, squares, triangles), or, if they wanted a challenge, they could make them more complex (trees, houses, cars), by combining shapes together. But, I explained, the most important thing was for them to enjoy the process. As they finished, I went around and saved their work (File > Export Image). I also uploaded the pictures to a shared Google doc, accessed with a link shortener so I could navigate to it quickly from each student’s computer. Finally, once all the students’ artwork was uploaded, we looked at the pictures and identified the ordinal position of different objects. For example, what is the position of the flower? What is in third place? You can see their pictures here. UPDATE: I have used Kleki to teach lessons in other first grade classes for shapes (SOL1.11a) Ms. Spencer & Ms. Milteer and patterns (SOL1.14) Ms. Sunseri & Ms. Burnett.
5th Grade Classifying Our Classmates
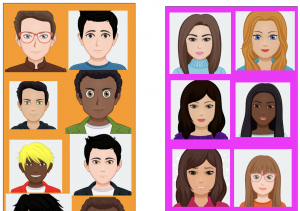 Fifth graders at Holladay Elementary have been learning about classifying objects (SOL5.1a) and organisms (SOL5.5b) using various characteristics. Today, students in Ms. Haislip’s class practiced this skill by classifying their classmates. First, we went to AvatarMaker and created an avatar that looked like us–same hair style, eye color, etc. We downloaded the image as a 200×200 png file (click “Download”). Then we uploaded it to a shared Google slideshow so everyone could see each other’s avatars. Once all the avatars were uploaded, I turned off file sharing so no one would accidentally move or delete the images. I arranged the avatars neatly on the slide then instructed the students to make a copy of the slideshow (File > Make a copy). On their own copies, they duplicated the class slide (Right click > Duplicate slide), and we discussed ways to classify the students into groups with common characteristics. The students had many great ideas: gender, hair color, eye color, glasses, facial expression, etc. They chose a characteristic and typed it in the top of the slide. Next, they clicked and dragged the images to sort them into groups. As an option for making the groups clearer, I demonstrated how to create shapes with the Shapes tool and send them to the back (Arrange > Order > Send to Back). If students finished, they could make additional copies of the slide and create different sorts. You can see some student examples here.
4th Grade Predicting and Graphing Virginia Rivers
 Fourth graders at Trevvett Elementary have been learning how to make graphs in Math (SOL4.14), and they have been studying the major rivers of Virginia in Social Studies (VS.2). Today, students in Ms. Catlett’s class predicted and graphed the lengths and discharge rates of the rivers. First we located the rivers on Google Maps. I created the map with different layers so that you can click the check boxes on the side of the map to turn on/off the rivers and/or the Virginia border as you discuss each one. We looked at the map scale at the bottom to try to predict the lengths of each river. If you wanted to show your students the watershed for each river (Science SOL4.9a), a great research tool is Streamer. Click the “Trace Upstream” button at the top, then click on a river, and the entire watershed will show up in red. I was amazed at how big the Potomac watershed was and how far it reached into Virginia! After discussing the lengths of the rivers, we tried to predict the discharge. Discharge is the volume of water flowing out the end of the river, measured in cubic feet per second (cu.ft./s). A cubic foot is about 7.5 gallons. We estimated the discharge rate of each river, taking into account their total length, watershed area, and size of the mouth (where it empties into the bay or ocean). Many students automatically assumed that longer rivers would have greater discharge rates, so I asked them a question to help clarify this misunderstanding. Does a longer hose have more water coming out the end than a shorter hose? What does affect how much water flows out the end of the hose? (Water volume, speed and the width of the hose). Does the discharge rate stay the same for each river, like its length? What would make the discharge rate change? (Amount of rainfall). Students recorded their predictions on this spreadsheet. Then they did some research to find the answers. Wikipedia has the information as well as simply asking Google, “What is the length/discharge of the ___ River?” The students entered the correct data into their spreadsheet and compared it to their predictions. Finally, I showed them how to highlight the data and graph it. The graph makes it very easy to see relationships between the rivers. You can see a few student examples here and in the screenshot above.
2nd Grade “Mystery Me” Introductions
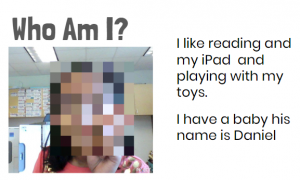 Second graders at Laburnum Elementary got to know each other better today with a fun “Mystery Me” activity. First, they went to Pixect and took a photo of themselves. Pixect is a great tool for taking quick webcam photos. It has an array of filters and timers available to use, but we just saved the photo and uploaded it to FacePixelizer, where the real magic happens. FacePixelizer is another great tool with many instructional uses. We used it today to pixelate our faces, but it can be used to make anything in a photo unidentifiable and mysterious: pixelate a book title, a weather instrument, or an animal, and students can try to guess what it is from various clues. It’s simple to use. Just click and drag across the area you want to pixelate. The amount of pixelation can be adjusted with a slider. Once we pixelated our faces, we downloaded the images and added them to a Google slideshow template that I gave them. The first slide was titled “Who Am I?” with two sentence starters: “I like…” and “I have….” The students completed the sentences with clues about themselves. On the next page they typed “I’m (Name)” and uploaded their original photo from Pixect. When they were finished, I combined all their slideshows together and added a Dissolve transition between them, so the pixelated photo gradually revealed the mystery student. You can see a few student samples here.

