
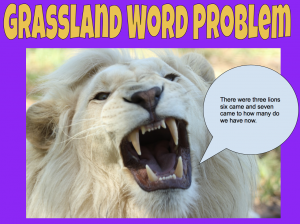
 Third graders at Trevvett Elementary have been solving addition and subtraction word problems in Math (SOL3.3b) and studying habitats in Science (SOL3.6ab), so today students in Ms. L’Heureux’s class created their own habitat word problems with Google Drawings. First we reviewed several different habitats and the animals that live in them (desert, grasslands, rainforest, arctic, etc). Next we thought about what kind of number problems could happen in their ecosystem and whether they involved addition or subtraction: animals could have babies, animals could die, animals could migrate, etc. The students came up with some creative ideas! Then we went to Google Drive and opened Google Drawings (New > More > Google Drawings). We created a background by clicking the Shapes tool, selecting a square, and using the Paint Bucket tool to give it a solid or gradient fill color. To add the title, we clicked Insert > Word Art, typed the title, pressed Enter, and changed the font, fill and outline colors. Then the students used the built-in Google image search to find a picture of an animal in its habitat. Finally, they added a speech bubble from Shapes and typed their addition or subtraction word problem inside it. We shared the links to our drawings in Schoology so our classmates could solve them in the comments. You can try to solve some of them for yourself here. (UPDATE: I adapted this lesson using Google Slides instead of Google Drawings for other classes because we wanted to make the answer appear at the end. I added some of those examples to the document).
3rd Grade Habitat Word Problems
4th Grade Decimals Calculator
 Fourth graders at Trevvett have been learning about decimals up to thousandths. They have learned how to compare decimals and round them (SOL4.3). Today, students in Ms. Cockrum’s class created their own decimals calculators with Google sheets. First, I asked if they knew of a calculator that could add or subtract decimals. They all did. Then I asked if they knew of a calculator that could compare or round decimals. None of them did, so they were very surprised when I explained that they would create a calculator that could do that. I pointed out that they would be coders today, and I wanted them to go through the same process that coders go through when creating a new program or app. Coders often start out with a flowchart to make sure that each step of the code is in the correct order. We discussed the steps a calculator would need to go through to compare two decimals. It would have to decide if one of the numbers was equal to (=), greater than (>) or less than (<) the other. Then it would have to display the correct symbol. A decision on a flowchart is usually a diamond shape, and the answer is either "yes" or "no." So our first decision could be, "Is A greater than B?" If the answer is "yes," the code would display a ">” symbol. If the answer was “no,” the code would continue to the next decision. The next decision might be, “Is A less than B?” and so on. The decisions could be in any order, but the final step isn’t really a decision, it would be a command to display the only symbol that was left. The shape for output in a flowchart is usually a parallelogram, but I told them they could use whatever shape they wanted. We used Google draw to make the flowcharts, then we opened this template in Google sheets to create the code. I instructed the students to type any decimal they wanted in the decimals columns. Then we wrote code, or formulas, in the other columns. Rounding is the easiest, so we started with that. I showed them the code for rounding to the ones place, then I let them figure out the code for rounding to the other places. The code for rounding a number in cell E2 is: ones place =ROUND(E2,0); tenths place =ROUND(E2,1); hundredths place =ROUND(E2,2). Next, we used our flowcharts to write the code for comparing decimals. If decimals are in cells A2 and C2, the code to display the symbol would go between them in cell B2. It may look something like this (but it could be in a different order):
=IF(A2 > C2,”>”, IF(A2 < C2,"<","="))
The students were excited to see their calculators working, and if they didn’t work, the students had to think critically and problem-solve to figure out the reasons. That’s actually one of the most valuable lessons of learning how to code. Our final step was to share the links to our spreadsheets on Schoology. You can see some samples from Ms. Cockrum’s class and Ms. Messer’s class (5th grade) here.
5th Grade Henrico Election Posters
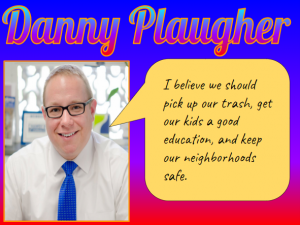 Fifth graders at Trevvett Elementary have been learning about Henrico county government (HC.2) in Social Studies, and they’ve been identifying the main idea and summarizing nonfiction text in Language Arts (SOL5.6d,e). Since elections are coming up in November, students in Ms. Harris’s class and Ms. Brown’s class conducted research to find information about the candidates running for office in Henrico County. Then we summarized our findings to create campaign posters. First, we used this site to see the list of candidates. Each student chose a candidate they weren’t familiar with since many of them already had a family favorite, and I wanted them to be exposed to different viewpoints. Next, they did a Google search for their candidate and explored their campaign website. I showed them where to look to find the “Beliefs” or “Issues” sections. After the students read some of their viewspoints, we discussed ways to summarize their views into a couple of sentences for the campaign poster. Students could use Google Docs, Google Slides, or Google Drawings (as well as other tools like DesignCap) to make posters, but we chose to use Google Drawings since we hadn’t used that tool yet. For the poster’s background, we added a square shape, made it as large as the poster, and changed the fill color so it was a solid color or gradient. Then we clicked “Insert > Word Art” and typed the candidate’s name. I showed them how to change the font, fill, and outline color of the text. We imported a photo of the candidate using the Google image search feature. Finally, we added a speech bubble with the Shapes button and typed a summary of the candidate’s beliefs. We shared our campaign posters on Schoology, but you can see them all here.
1st Grade Fall Videos
 First graders at Holladay Elementary have been learning about the fall and how it affects animals, people, and the weather (SOL1.7). Today, students in Ms. Sokolowski’s class used WeVideo to create their own fall videos. First, they chose a partner to work with, and one of the partners signed into WeVideo using their Google account. I showed them how to press the red record button and set up their webcams following the on-screen prompts. Next, we brainstormed ideas to talk about, making sure they understood that the topic was fall (sometimes first graders like to go off topic :). We also discussed the importance of looking at the camera and speaking loudly and clearly. Ms. Sokolowski and I recorded a sample video to model the process for the students.
Finally, the students were ready to record their own videos. We walked around, providing guidance as needed and trying to stay out of their movies. When they were finished, I showed them how to save their videos. We downloaded them and saved them to our Google drive (if you have the free version of WeVideo, the videos will eventually be removed over time, so be sure to download them if you want to keep them). You can see some of the students’ videos here.
1st Grade Fall Videos
First graders at Holladay Elementary have been learning about the fall and how it affects animals, people, and the weather (SOL1.7). Today, students in Ms. Sokolowski’s class used WeVideo to create their own fall videos. First, they chose a partner to work with, and one of the partners signed into WeVideo using their Google account. I showed them how to press the red record button and set up their webcams following the on-screen prompts. Next, we brainstormed ideas to talk about, making sure they understood that the topic was fall (sometimes first graders like to go off topic :). We also discussed the importance of looking at the camera and speaking loudly and clearly. Ms. Sokolowski and I recorded a sample video to model the process for the students.
Finally, the students were ready to record their own videos. We walked around, providing guidance as needed and trying to stay out of their movies. When they were finished, I showed them how to save their videos. We downloaded them and saved them to our Google drive (if you have the free version of WeVideo, the videos will eventually be removed over time, so be sure to download them if you want to keep them). You can see some of the students’ videos here.
Varina Library Rap
 Varina Elemenatry started a reading incentive program to encourage students to read 40 books or more. Today we recorded a rap video that will be shown to the whole school, explaining the program. Mr. Jones, the PE teacher, and Ms. Jackson, the art teacher demonstrated their rapping skills with raps they wrote themselves! Students also choreographed their own dance routine to accompany the video. My job was to add the green screen effects. Since we didn’t have a green screen, I just hung up some green bulletin board paper. I also hung up some orange bulletin board paper for students who were wearing green (you can use any color, as long as the performers aren’t wearing that color). Then I recorded them using the DoInk Green Screen app on an iPad. Within the app, you can choose the color you want to be transparent and add a background to replace it. I used some generic music video backgrounds that I downloaded. The last step was to add the song files. We shared the finished video on Google drive so all the students could see it. You can watch it here.
Varina Library Rap
Varina Elemenatry started a reading incentive program to encourage students to read 40 books or more. Today we recorded a rap video that will be shown to the whole school, explaining the program. Mr. Jones, the PE teacher, and Ms. Jackson, the art teacher demonstrated their rapping skills with raps they wrote themselves! Students also choreographed their own dance routine to accompany the video. My job was to add the green screen effects. Since we didn’t have a green screen, I just hung up some green bulletin board paper. I also hung up some orange bulletin board paper for students who were wearing green (you can use any color, as long as the performers aren’t wearing that color). Then I recorded them using the DoInk Green Screen app on an iPad. Within the app, you can choose the color you want to be transparent and add a background to replace it. I used some generic music video backgrounds that I downloaded. The last step was to add the song files. We shared the finished video on Google drive so all the students could see it. You can watch it here.
5th Grade Plate Tectonics
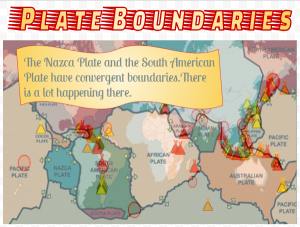 Fifth graders at Varina Elementary have been learning about changes in the Earth’s crust due to plate tectonics (SOL5.7e). Today, students in Ms. Gallahan’s class used their analysis skills to look for correlations between a map of the Earth’s plates and a map of current earthquakes and volcanoes. First, they made a copy of a Google drawing template showing a map of the Earth’s plates (you can get your own copy here). Next, I showed them how to add a fancy title using Word Art (Insert > Word Art). I demonstrated how to change the size, font, fill color, and outline. Then we went to this site to see where there are current volcanoes and earthquakes. The students were surprised to see so many going on all over the world! We took a screenshot of the map with the Snipping Tool (on Chromebooks you can also use the Windows Key + Ctrl + Shift to take a screenshot). We pasted the screenshot into our Google drawing, and I showed them how to make it half transparent using the Format Options menu (Adjustments > Transparency). The tricky part was resizing the screenshot so the continents were the same size and matched up on both maps. Once they were aligned, it was easy to see some correlations. The volcanoes and earthquakes were happening along the plate boundaries! The plates map has arrows showing their movements, so we could figure out which ones were convergent, divergent, and transform boundaries. I instructed the students to get a shape from the Shapes tool, change its color, and type one or two of their discoveries and conclusions in the shape. Finally, we shared our posters in Schoology. You can see some of them here.
4th Grade Virginia Math Quizzes
 Fourth graders at Varina Elementary have been learning about Virginia geography in Social Studies (VS.2) and rounding and place value in Math (SOL4.1). Today, students in Ms. Stevens’ class synthesized these concepts, along with research skills, to create Virginia Math quizzes using Google forms. First, I explained that we would be creating 1-question quizzes, but when we took each others’ quizzes, we would end up answering several questions. So their job was to create a really good question about place value or rounding that would make their classmates think. We reviewed types of questions they could ask: What is the value of the digit __? What number is in the __ place? How would you write this number in word form? What is this number rounded to the nearest ten thousand? Next, they had to do research to find a fairly large Virginia number. I showed them how they could use the microphone tool to audibly ask Google a question like: What is the population of Richmond? How tall is the tallest mountain in Virginia? How many chickens live in Virginia? How far is it from Roanoke to Arlington? How long is the James River? Once they had their number and a math question, we opened a blank Google form (New > More > Google Form), and they typed their question. I pointed out that their multiple choice answers should be tricky, based on errors that students typically make. For students who finished early, I showed them how they could change the theme of the form and add images. To turn their regular Google forms into self-grading quizzes, I demonstrated how to go to the gear icon at the top, click the Quizzes tab in the pop-up window, and change it to a quiz. Then, they had to mark the correct answer to their question. Finally, we shared the links to our forms on Schoology, and took each others’ quizzes. You can see them all here.
4th Grade Virginia Math Quizzes
Fourth graders at Varina Elementary have been learning about Virginia geography in Social Studies (VS.2) and rounding and place value in Math (SOL4.1). Today, students in Ms. Stevens’ class synthesized these concepts, along with research skills, to create Virginia Math quizzes using Google forms. First, I explained that we would be creating 1-question quizzes, but when we took each others’ quizzes, we would end up answering several questions. So their job was to create a really good question about place value or rounding that would make their classmates think. We reviewed types of questions they could ask: What is the value of the digit __? What number is in the __ place? How would you write this number in word form? What is this number rounded to the nearest ten thousand? Next, they had to do research to find a fairly large Virginia number. I showed them how they could use the microphone tool to audibly ask Google a question like: What is the population of Richmond? How tall is the tallest mountain in Virginia? How many chickens live in Virginia? How far is it from Roanoke to Arlington? How long is the James River? Once they had their number and a math question, we opened a blank Google form (New > More > Google Form), and they typed their question. I pointed out that their multiple choice answers should be tricky, based on errors that students typically make. For students who finished early, I showed them how they could change the theme of the form and add images. To turn their regular Google forms into self-grading quizzes, I demonstrated how to go to the gear icon at the top, click the Quizzes tab in the pop-up window, and change it to a quiz. Then, they had to mark the correct answer to their question. Finally, we shared the links to our forms on Schoology, and took each others’ quizzes. You can see them all here.

