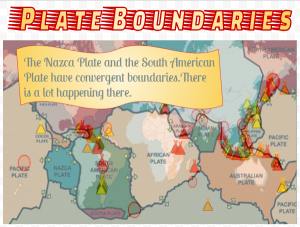
 Fifth graders at Varina Elementary have been learning about changes in the Earth’s crust due to plate tectonics (SOL5.7e). Today, students in Ms. Gallahan’s class used their analysis skills to look for correlations between a map of the Earth’s plates and a map of current earthquakes and volcanoes. First, they made a copy of a Google drawing template showing a map of the Earth’s plates (you can get your own copy here). Next, I showed them how to add a fancy title using Word Art (Insert > Word Art). I demonstrated how to change the size, font, fill color, and outline. Then we went to this site to see where there are current volcanoes and earthquakes. The students were surprised to see so many going on all over the world! We took a screenshot of the map with the Snipping Tool (on Chromebooks you can also use the Windows Key + Ctrl + Shift to take a screenshot). We pasted the screenshot into our Google drawing, and I showed them how to make it half transparent using the Format Options menu (Adjustments > Transparency). The tricky part was resizing the screenshot so the continents were the same size and matched up on both maps. Once they were aligned, it was easy to see some correlations. The volcanoes and earthquakes were happening along the plate boundaries! The plates map has arrows showing their movements, so we could figure out which ones were convergent, divergent, and transform boundaries. I instructed the students to get a shape from the Shapes tool, change its color, and type one or two of their discoveries and conclusions in the shape. Finally, we shared our posters in Schoology. You can see some of them here.


