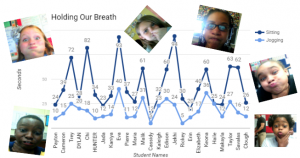
 Fifth graders at Varina Elementary have been learning about the scientific method in Science (SOL5.1) and nonfiction text features in Language Arts (SOL5.6a). To reinforce those concepts, students in Ms. Rumans’ and Ms. Gallahan’s classes conducted a quick experiment and wrote about the scientific method they followed, including some nonfiction text features. First I made a copy of a blank Google doc for each student in Google classroom. I usually like to review word processing skills for my first technology lesson. I showed them how to add a title and change the font, size and color. Then we wrote about our experiment using the vocabulary words we have learned: hypothesis, independent variables, and dependent variables. I demonstrated how to make the important words bold (a feature of nonfiction text). Next we opened this template (I changed the Share settings to “Anyone with the link can edit”) and each student typed their name in column A using the row with their student number. First we timed how long we could hold our breath while sitting quietly using Google stopwatch (just do a Google search for “stopwatch”). Then we ran in place for a minute and timed how long we could hold our breath. Students recorded their times in columns B and C. The template automatically generates a line graph. After collecting our data, the students went back to their own Google docs and clicked Insert > Chart > From Sheets. They navigated to the spreadsheet we just completed and clicked on the graph. Finally we added a photo of ourselves holding our breath by clicking Insert > Image > Take a snapshot. I linked their individual documents to their names on the spreadsheet. You can check out Ms. Gallahan’s class results here.
5th Grade Scientific Method
5th Grade Scientific Method
 Fifth graders at Varina Elementary have been learning about the scientific method in Science (SOL5.1) and nonfiction text features in Language Arts (SOL5.6a). To reinforce those concepts, students in Ms. Rumans’ and Ms. Gallahan’s classes conducted a quick experiment and wrote about the scientific method they followed, including some nonfiction text features. First I made a copy of a blank Google doc for each student in Google classroom. I usually like to review word processing skills for my first technology lesson. I showed them how to add a title and change the font, size and color. Then we wrote about our experiment using the vocabulary words we have learned: hypothesis, independent variables, and dependent variables. I demonstrated how to make the important words bold (a feature of nonfiction text). Next we opened this template (I changed the Share settings to “Anyone with the link can edit”) and each student typed their name in column A using the row with their student number. First we timed how long we could hold our breath while sitting quietly using Google stopwatch (just do a Google search for “stopwatch”). Then we ran in place for a minute and timed how long we could hold our breath. Students recorded their times in columns B and C. The template automatically generates a line graph. After collecting our data, the students went back to their own Google docs and clicked Insert > Chart > From Sheets. They navigated to the spreadsheet we just completed and clicked on the graph. Finally we added a photo of ourselves holding our breath by clicking Insert > Image > Take a snapshot. I linked their individual documents to their names on the spreadsheet. You can check out Ms. Gallahan’s class results here.


