
Last year Jessica Robinson, an awesome Henrico County Elementary ITRT, blogged about using an awesome free online graphing tool on the Math is Fun website. This is a great resource because it is very similar to what the students will see at the end of the year on their SOL tests. I wanted to try this out and share this great resource with my teachers, so I used in it Mrs. Reed’s third grade classroom.
First, the students and I had a discussion on bar graphs and different things that could be graphed. As the students came up with ideas I wrote them on the board. I then had the students decide what they wanted to graph. They could choose something from the list we came up with as a class, or they could think of something completely new.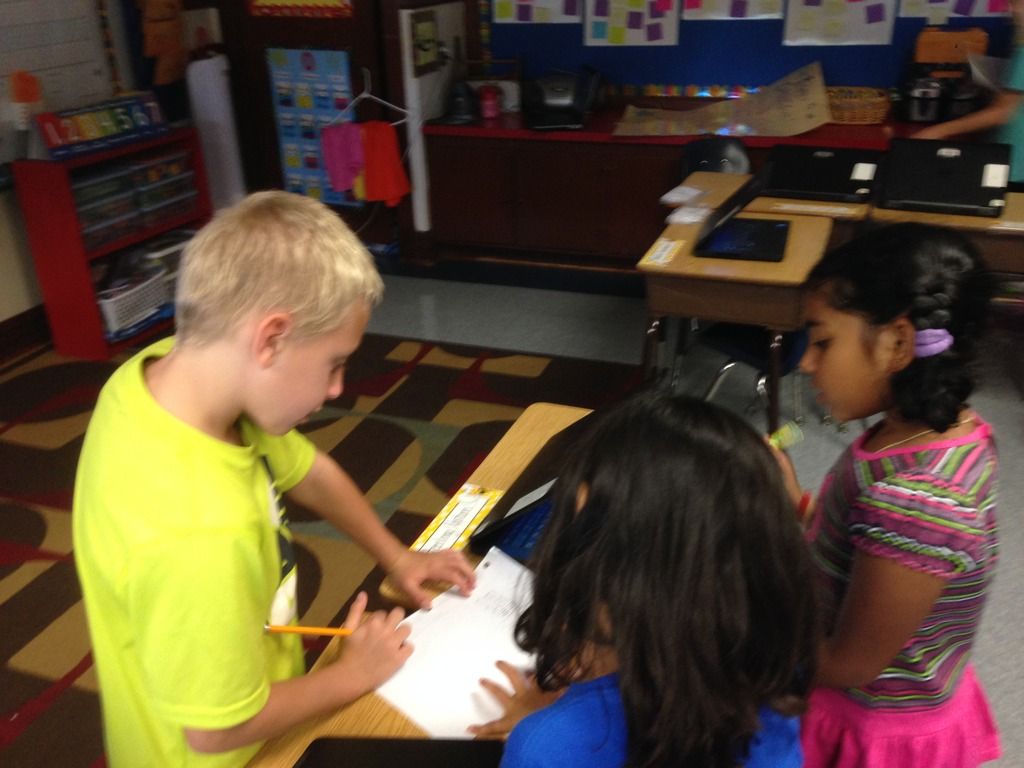 The students walked around the room gathering data for their graphs. Once the students collected all of their data we regrouped as a class.
I then showed the students how to use the tool. The students changed the title and then changed everything on the x-axis. The students then completed their bar graphs using the data that they collected. We used the snipping tool to take screenshots of their graphs. Once the graphs were saved to the student desktops they headed over to a Padlet wall that I had created for us. I love Padlet because it’s SO easy for the students to share their work. Even though the tool is so powerful for students I think the best part about Padlet is reaction from the students when they post and start seeing all of their classmates’ work. They can’t help but say WOW! Even when I explain to them what’s going to happen they are so excited about it! The kids were fantastic, and did some great work. Check it out!

