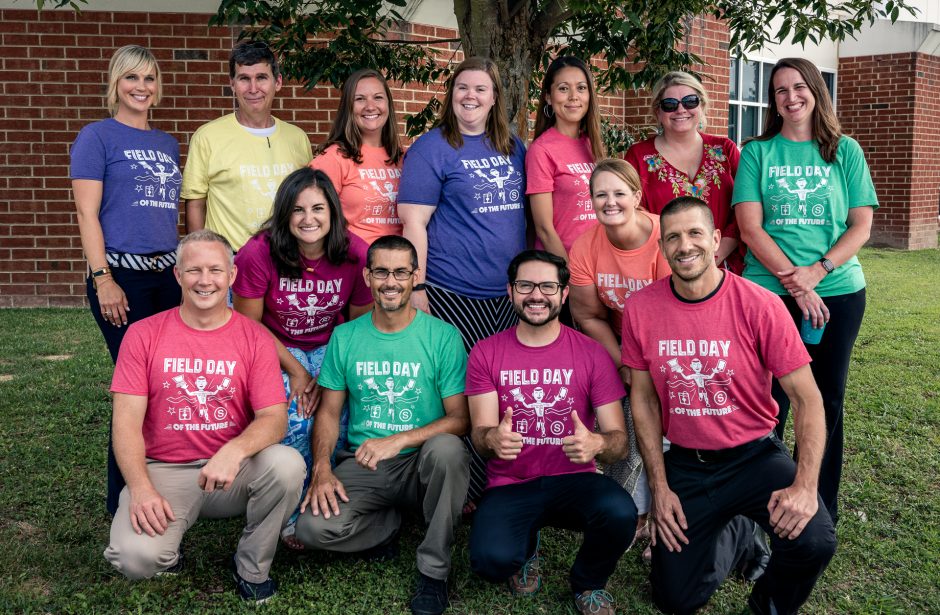
 Day 4 of our week long Tech Takeout extravaganza was AWESOME! We headed over to Arthur Ashe Elementary and focused on division, word problems, elapsed time, and line graphs in 5th grade. The students had a blast using a variety of technology while thinking critically. One more day left, and we are still excited! This has been an amazing week, and can’t wait to head to Glen Lea Elementary tomorrow!
For the opening activity Gina Browne had an amazing idea for a pre-assessment for how the students felt about math going into the day. The students used the word cloud feature on abcya.com. Once they typed in three adjectives describing how they felt, the students saved the word cloud to their desktop. They then headed over to a Padlet wall that Mrs. Browne created for each individual class so the students had an opportunity to see how everyone was feeling.
 Gina Browne and Julie Smith used EdPuzzle for challenging word problem practice. EdPuzzle allows the teacher to find a video or upload their own video to the website. The teacher can crop the video, add a voice over and/or embed quiz questions. This program is great for a flipped classroom environment or even a great tool to use for centers/rotations. Students in this group viewed and worked on two different word problems involving fractions.Check it out:
 Sarah Green and Karen Hues had the students use Google Maps to find how much time it takes to travel from Arthur Ashe Elementary School to a destination of their choice. Then they chose a starting time and calculated the elapsed time to find out what time they would arrive at their destination. They posted a screenshot of their travel route along with their elapsed time word problem on a padlet wall to share with their classmates.
Jessica Robinson and Stephanie Wright had their group using multiple online resources. Their students started out by choosing a vacation spot that interested them. They then accessed The Weather Channel website and recorded the high and low temperatures for the next five days at that vacation destination. After their data was collected they signed into their Google account and plugged in their data on a Google Sheet. After their data was recorded they created a line graph within Google Sheets. They personalized their graph and then copied into a group Google Presentation. After their resized their graph they used the image search feature and found a few key places at their vacation destination to add to their slides. Check out their great graphs!
 Jim Covais and Matt Caratachea were training some future computer programmers using Scratch and MaKeyMaKeys. First, the students wrote division word problems and then headed over to the Scratch website. Next, the students selected two sprites to work with. The students programmed one of the sprites to state the word problem when the up key was pressed. We programmed the other sprite said the answer when the students pushed the down key. When the students finished programming they hooked up the MaKeyMaKeys to control what they had just programmed. An alligator clip was attached the the up arrow on the MaKeyMaKey and then another alligator clip was hooked the down arrow on the MaKeyMaKey. The students connected their last clip was to the ground, and they were almost good to go! The finishing touches were when we put Playdough on the other ends of the alligator clips. The students were completely blown away when they were controlling the computer with Playdough!
Gina Browne’s Slidely by Slidely Slideshow


