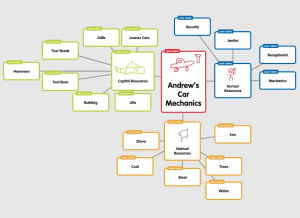
 Third graders at Holladay Elementary have been learning about natural resources, capital resources, and human resources in economics (SOL3.7). Their benchmark tests also revealed that they need additional practice identifying the main idea and details in what they read (SOL3.5,3.6). Making a diagram is a great way to clarify main idea and details, so today students in Ms. Middleton’s class created business diagrams using Popplet. First the students decided what kind of business they wanted to have, and they created a bubble with the name of their business. I showed them how to change the color of the bubble and draw a picture. Then we added three bubbles connected to that bubble (click the little dots around the bubble to add connecting bubbles). We labeled them natural resources, capital resources, and human resources. We also drew a picture for each one and made the bubbles different colors. I explained that if we were going to write a paragraph about our business, those would be the main ideas for three paragraphs. Now we would add the details. Students added connecting bubbles to each type of resource with items from their business that pertained to that category. When they were finished, they downloaded their images and posted them to Google classroom so they could see each others’ work. You can take a look at some of them here.


