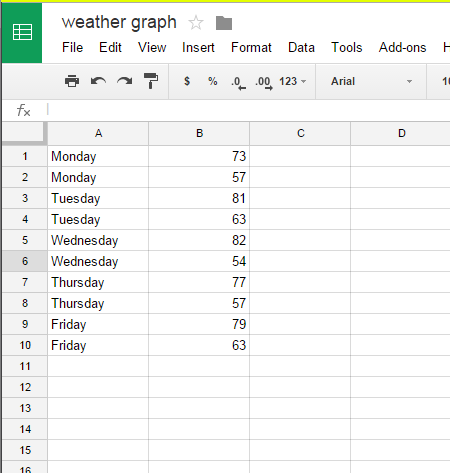
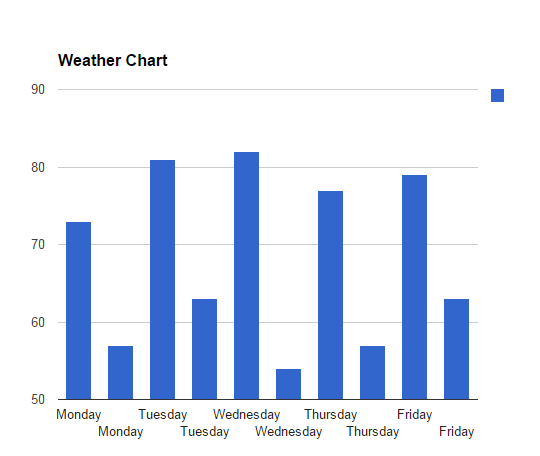
Second graders at Seven Pines collected temperature date for a week. The students collected the high and low temperature each day for an entire week. Once the data was collected, students organized the temperatures in a Google spreadsheet. Once the temperatures were in the spreadsheet, they then graphed the temperatures showing the highest and the lowest temperatures for the week.