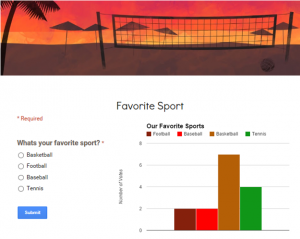
 Fourth graders at Davis Elementary are learning about data collection and graphs (SOL4.14), so today, Ms. White’s students collected data from their classmates using Google forms. They chose a topic of interest to them and selected their own Google form template. Then they wrote their question, such as “What is your favorite thing to read?” or “Who is your favorite singer?” and provided four choices. I showed them how to load the live form, then they traveled around the room completing each others’ forms. At the end of the process, each student had between 16-20 responses. Now it was time to do some data analysis. They looked at the Google spreadsheet with the responses and counted the votes for each choice. Next they added that information to their spreadsheet and graphed the results. I showed them how to customize the fonts, colors, and labels of the graph. You can see all their graphs and forms by clicking here.


