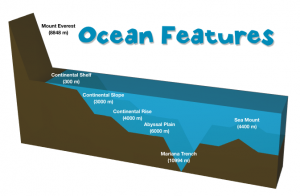
 Fifth graders in Ms. Payne’s class at Laburnum Elementary have been studying the ocean (SOL5.6), and she wanted me to help them review the different parts of the ocean floor. One of my goals this year is to help our students improve in math, so I’ve been trying to incorporate math into as many of my lessons as possible. I figured we could use the 3-D area graph in Numbers to create a model of the ocean and then import it into Keynote to animate it like this example. I wanted the students to gather their own data, but just graphing that wouldn’t produce a good looking model. So I created a template that you can download by clicking here that takes the data they enter and turns it into a model of the ocean floor. The students used Google Earth to gather the data for the graph. First I told them to find a continental shelf and measure the depth. Google Earth automatically tells the ocean depth or land elevation for whatever spot your mouse is hovering over… just be sure it’s in meters and not feet or my formulas won’t work (you could add a bit more math by having them convert the units). Next the students find a continental slope, continental rise, abyssal plain, and sea mount to measure. After entering all that data, I told them to do some research online to find the depth of the Mariana Trench. I gathered a bunch of sites for oceans research into a BundleNut that they could use, but one of the coolest infographics I found was this one. Once they entered that last bit of data, the 3-D graph should look like a model of the ocean floor. Then they copied the graph and pasted into a Keynote to animate it. Keynote has a sharp-looking animation for graphs called “3-D grow.” The students used text boxes to label the different parts, and the final step (if we got to it, which we didn’t) would be to record a voiceover explaining each part of the ocean floor.


