
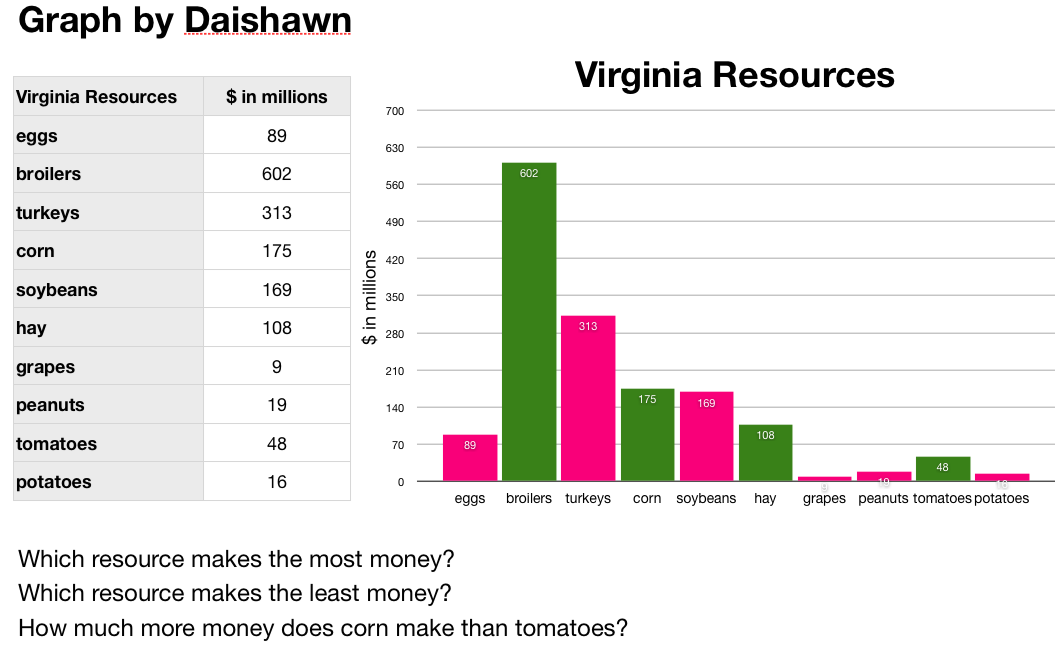
 Fourth graders at Davis Elementary have been learning in science about the different natural resources produced in Virginia (SOL4.9). In math they’ve been learning about graphing. So today we did some research to gather hard data about Virginia’s resources and graphed the information we found using the Mac spreadsheet program, Numbers. First we predicted which resources are the top ones produced in Virginia. Many students guessed coal and tobacco. Next we went online to two sites I created about Virginia’s mineral resources and farm products. (I created my own sites because the sites with the data, which I cited, did not have any pictures so students may not have known what those products were… like I didn’t know what “broilers” were). I pointed out that the data is hard to visualize when it’s just a list of numbers. That’s how graphs help! So the students selected which data they wanted to graph and entered the information into a Numbers template that you can download by clicking here. Then I showed them how to graph the data and customize the colors. Finally they made up a few questions of their own about the data for a partner to answer.

