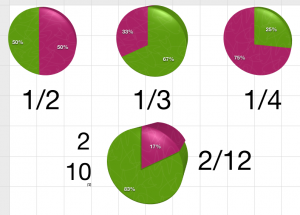
 Third graders in Mr. Friend’s class are studying fractions, so today I showed them how to make fraction pies using a program called Numbers (the Mac version of Excel). The was the first time many of them had seen a spreadsheet so I explained the parts. The naming of each cell, (A2, B4, etc) was familiar to them because they studied map grids which use a similar format. I explained that we couldn’t just write a fraction like 3/4 in the cells and generate an accurate fraction pie. To show them what happens we typed 3 in A1 and 4 in A2, highlighted them both, clicked the Charts button and picked a pie chart. It made a fraction pie that looked like 3/7. After trying a couple more that way, the students figured out that the computer is taking the top number and making pieces of pie one color, then taking the bottom number and making pieces of pie another color. So they had to “trick” the computer into making the correct pie chart to represent the fraction accurately. In order to get a pie showing 3/4, we had to type 3 on top and 1 underneath. We tried that strategy with a couple of basic fractions until they got it right. Then they made up their own fraction, created a pie chart for it, and their neighbor had to identify the fraction. Before saving their work, I showed them how they could change the colors of the pies (they love that, but I try to save it until the end or they get distracted by it)! If you’d like to try another Numbers activity comparing fractions and showing mixed fractions, look at this post.


