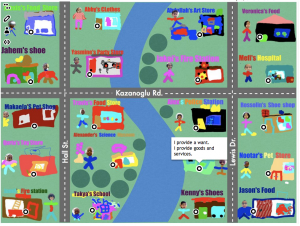
 Today first graders at Chamberlayne Elementary combined their knowledge of map skills (SOL1.4) and goods and services (SOL1.7) in a special project. Each class created their own interactive town map where you could click on a building and see whether it produced goods or services. Here’s how we did it. First we discussed what goods and services the people in a town would need or want. Then I instructed the students to choose one and design their store in Pixie. If we noticed that too many students were picking one type of store, we’d say, “We have a lot of pet stores in our town, what is something else our town should have?” I asked them to include several elements in their Pixie drawings: their names, their stores’ names, pictures of themselves, and pictures of what they sell or provide. I also asked them to highlight whether they provided goods or services or both. They exported their finished pictures as PNG files with transparent backgrounds. Next I added their buildings to a town map in Keynote (you can download the files we used for this project here). I uploaded the map to ThingLink and added the clickable hotspots. Since ThingLink sometimes has ads, I didn’t want to directly link to those, so I embedded them into Instabloggs. You can see the finished products from each class by clicking the links: Ms. Gardner, Ms. McLean, Ms. Kazanoglu. Teachers could then use these maps to review knowledge and encourage critical thinking: Is our town lacking anything? Which side of the river would you live on and why? Which direction would you travel to get from one specific store to another? Parents can also view the maps from home and leave comments!


