
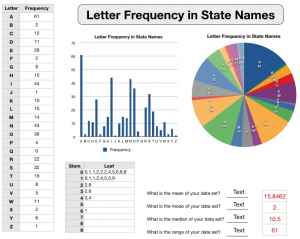
 Fifth graders in Ms. Corfield’s class at Chamberlayne Elementary have been learning about the different states in social studies. They have also been studying mean, median, mode, range, and stem and leaf plots in math. So Ms. Corfield came up with a great idea that would help students review all of these concepts! One of the benefits of project-based learning is the ability to connect cross-curricular topics in one assignment like this example. First the students had to figure out the number each letter occurs in all the states’ names. They could come up with their own strategies for accomplishing this task (some may even discover online tools like this one that count the occurrences of each letter in whatever you type). Once they had their data, they entered it into a template that I created for them. You can download it by clicking here. The template automatically generates a bar and pie graph of the data. The students had to create a stem and leaf plot of the data themselves. A quick way to do this is to sort the numbers by clicking on the heading of Column B and choosing “Sort Ascending” (afterwards they will need to click on the heading of Column A and choose “Sort Ascending” to put everything back in order). Next, students calculated the mean, median, mode, and range of the data. They could use any of the spreadsheet tools available to them to do this. Some will discover that when they highlight all the numbers, the median (average) is automatically calculated over on the bottom left side of the spreadsheet. Letting students make discoveries like this on their own is far more effective than you pointing it out to them. Here’s a final trivia question for you: Which is the only letter that is not found in any state name?

