Summary
This project will introduce students to colleges in the A10 and ACC basketball conferences. Students will follow the basketball teams up to the Final Four tournament and learn about the colleges they represent. Math skills will be used as students calculate team scoring percentages and averages. An understanding of statistics will be developed by comparing team statistics to decide who are the conference’s best teams and individual players. Meaningful statistics will also be discovered as students create infographics for each college in the conferences. Students will work in collaborative pairs on each college. Local college students also will be working as tutors/mentors with the students. Before the conference tournament students will work collaboratively to predict conference winners and decide on the conference best teams and individuals
TIPC Ratings
Students will be introduced to using a variety of websites to find statistics related to their colleges and basketball teams at those colleges. Students will use Google Spreadsheets to create the basketball team statistics and averages. They will use a variety of tools to design and create an infographic displaying graphical and pictorial information representing their colleges..
Student created groups work collaboratively using google docs as a tool to complete multiple projects using information gathered from a variety of websites. College students from local colleges worked with the students to discuss the importance of the information they found in making the decision of what college to attend.
By providing the students with a variety of options in how they choose to use the data they are researching to complete the project students have an opportunity to make decisions and problem solve the best ways to use and present the information they locate. Students will use the information they find to make predictions about winners of the basketball tournaments. They will choose information they believe best represents the colleges they are looking at from the perspective of a prospective student.
Students are introduced to tools to design and create infographics. Using the information and statistics found during research students are expected to apply their knowledge of statistics and problem solving abilities to decide what is important and how to creatively display the information in an infographic.
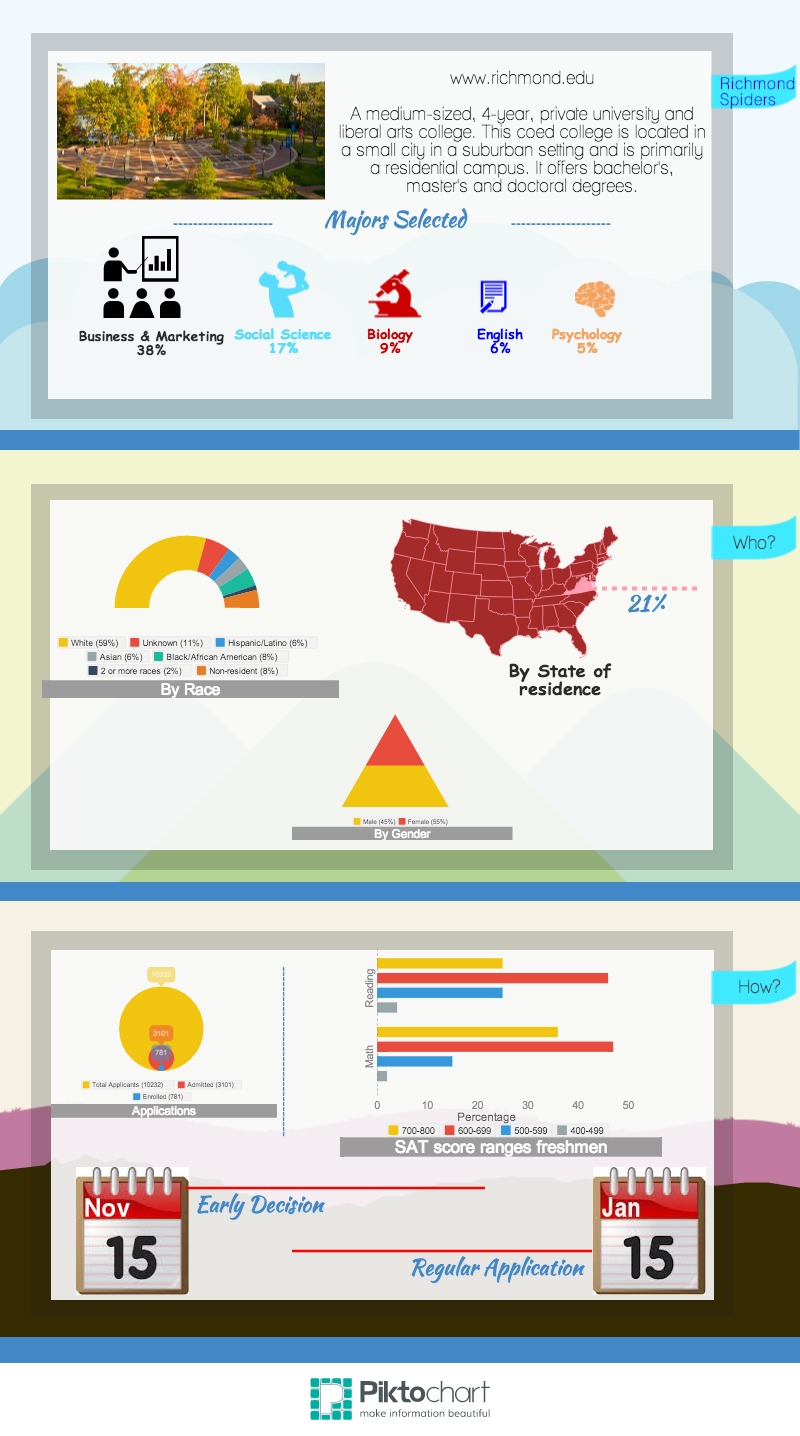
Student Artifact