Submitted by: Holly Condon
School: J.R. Tucker High School
Summary
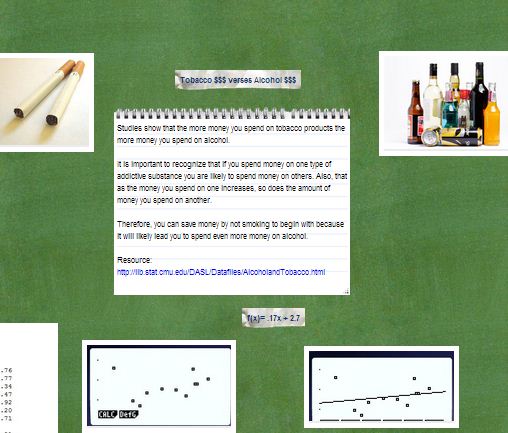
Students were given two items that were related. They were to create 3 higher-level (Bloom’s) questions about the relationship between the two items. Next they identified the Independent and Dependent Variables and made a prediction as to whether the relationship trend was positive or negative. Then students entered data into a graphing calculator, created a scatter plot, and wrote an equation of the line of best fit. After they converted the equation to function notation, they entered it on a class collaborative Google spreadsheet, made another prediction based on the f(x) value, and explained their answer. They also reviewed others students answers and commented in the spreadsheet as to whether they agreed/disagreed and why. Additionally, they compared/contrasted the two relationships. As a culminating project, students chose a topic of their own, determined data to be collected, conducted research, wrote a function, made a prediction, created an online project, and presented their findings to the class.
TIPC Ratings
DEVELOPING – Students had to identify independent and dependent variables. If they were unsure of what the vocabulary terms meant, then they had to look the information up in either their textbook or online. As a culminating project, students chose a topic of their own, determined data to be collected, conducted research, wrote a function, made a prediction to create an online project.
DEVELOPING – Students worked in pairs to create questions about the relationship between the two items. After they determined the equation of the function, they entered it on a class collaborative Google spreadsheet. They reviewed others students answers and commented in the spreadsheet as to whether they agreed/disagreed and why. The teacher also addressed appropriate commenting via the google doc.
APPROACHING – Students were to create 3 higher-level (Bloom’s) questions about the relationship between the two items. They used words like: Compare, Contrast, What if, Describe, Identify, Interpret, Explain, Demonstrate, Show, Classify, How…They also made a prediction as to whether the relationship trend was positive or negative. Then students entered data into a graphing calculator, created a scatter plot, and wrote an equation of the line of best fit. After they converted the equation to function notation, they made another prediction based on the f(x) value, and explained their answer. They also reviewed others students answers and commented in the spreadsheet as to whether they agreed/disagreed and why. Additionally, students had to compare/contrast the two relationships and explain how the information and function could be helpful in a real world situation. As a culminating project, students chose a topic of their own, determined data to be collected, conducted research, wrote a function, made a prediction, created an online project, and presented their findings to the class.
DEVELOPING – Students were given two items that were related. They were to create 3 higher-level (Bloom’s) questions about the relationship between the two items. The students were very creative in the types of questions they came up with. They also had to analyze the graphs and make predictions based on the scatterplot. As a final project, students had to synthesis everything they had previously learned and create their own presentation.


