Submitted by: Madeline Damron
School: Pinchbeck Elementary School
Summary
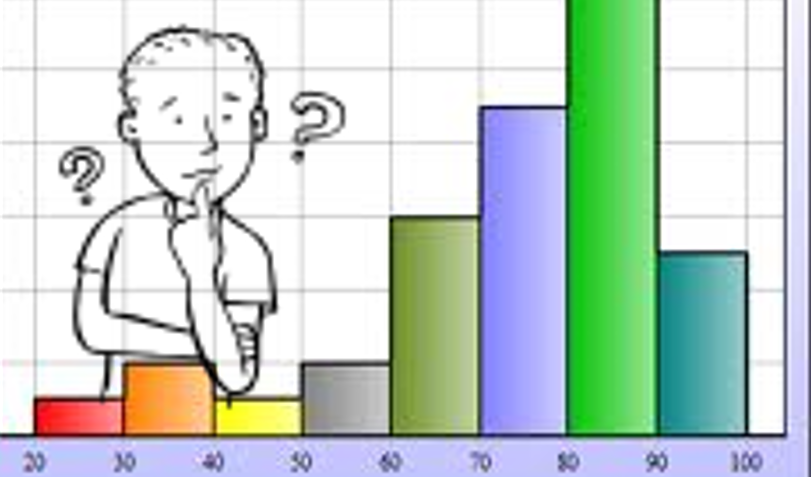
Students will work in teacher-created collaborative teams to gather survey data from other classes at our school. For the first lesson, we will all use the same survey question. Student teams will use the website: nces.ed.gov/nceskids/createagraph/ to create bar graphs using their survey information. Student teams will generate questions and correct answers using the data displayed in
bar graph format. Student teams will then present their graphs and questions to the class for answers.
TIPC Ratings
Developing – Students collected their own data using a specific digital tool to create bar graphs.
Developing – Students worked in teacher-created collaborative teams to collect survey data, input data onto a spreadsheet, generate graphs, and create questions regarding information on their graphs. Once students are more comfortable formulating and asking questions, teams could present their graphs and questions to the classes they surveyed.
Approaching – Students practiced critical thinking skills by analyzing authentic survey data and graphs. Students generated questions and correct answers using the data displayed in bar graph format and a Word Bank with required vocabulary word choices.
Developing – Students used critical thinking and research methods to create predetermined work. For the first lesson, I felt it was important for first grade students to use the same survey questions. For subsequent lessons, students could work with a team to create their own survey questions.
Student Artifact