Submitted by: Wylie Schweider
Collaborators: Isaac Carey
School: Henrico High School
Summary
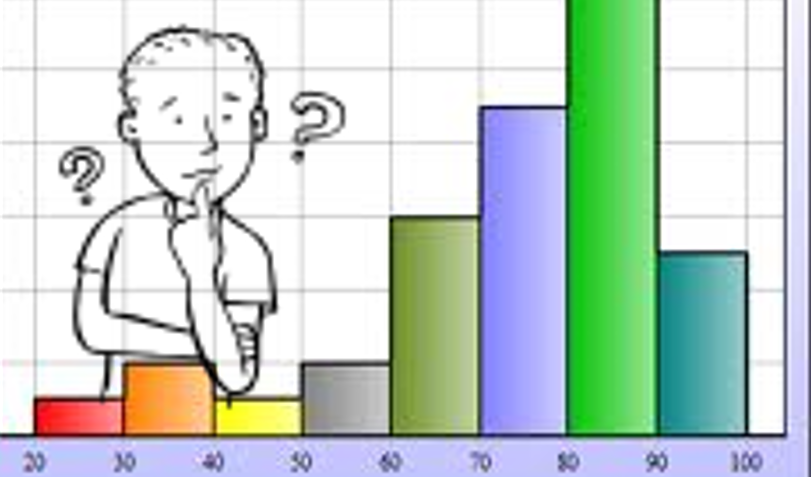
The objective of this lesson was for students to understand how Excel or a graphing calculator could be used to model the data pertaining to the death rates at World War II concentration camps. In addition, students understood the meaning behind the visual aspects of a cumulative frequency diagram and the main use of a cumulative frequency diagram.
Students worked in pairs and used Excel or a graphing display calculator to create a cumulative frequency diagram based on supplied data on the post-liberation death tolls at the Bergen-Belsen concentration camp. Each student had reference material on how to create and edit their graph, and tailored the graph to given specifications. Next, the students interpreted the meaning behind the frequency graph, from both a mathematical and “real-world” stance.
In the second part of the project the students created a second cumulative frequency graph, but they were required to find their own data on a topic of their choice, and develop similar questions to ask their classmates. As a follow-up activity, students evaluated the data, graphs, questions and answers developed by other pairs and critiqued their products
TIPC Ratings
This lesson falls in the approaching level of research and information and fluency. Students used specific tools to assemble and evaluate information. Students answered scripted questions and created their own questions searching for data to use to analyze in order to answer their questions.
This lesson falls in the developing level of communication and collaboration. Students formed collaborative teams to solve real-world problems and create original works, which they evaluated as a team and as a class. Students also used a discussion board to provide feedback to students in other groups and other classes
This lesson falls in the approaching level of critical thinking and problem solving
Students both selected and used provided and resources to draw conclusions and reflect on their products and processes. Students used prior research and knowledge from other subjects such as history, psychology and Theory of Knowledge to develop and answer open-ended questions using higher order thinking skills.
This lesson falls in the approaching level of creativity and innovation. Students work collaboratively to produce products that analyze data that has value for specific audiences. They apply innovative thinking and creative uses of research methods to create data graphs that have elements of originality and teacher defined requirements..
Student Artifact