This lesson is for : Grade 4:
Summary
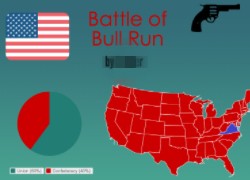
Society is obsessed with finding the biggest and the best of everything from sports to entertainment, and our fourth graders are no different. They want to find out which of Virginia’s battles was our greatest victory. It’s not an easy task because many important battles from the Revolutionary War through the Civil War have been fought here (VS.5c & VS.7b). First we decide together which data we should examine to compare the battles. We agree that looking at at the casualties for each battle will give us the best results. Next we discuss how to display the data so that we can easily compare the battles. We look at examples from the real world of news, sports, and entertainment and discover that infographics are an excellent way to display and compare data. To simplify the task, each student chooses a battle to research and displays the data in an infographic using a webtool called Piktochart. We agree to display the casualties in a pie chart so we can compare the fractions with each other (Math SOL4.2a). Finally we post our infographics to our Google classroom page. Our classmates estimate and compare the fractions shown in the pie charts using the comments section under each infographic. After analyzing the fractions we determine Virginia’s greatest victory. Which battle do you think it is? Take a look at some samples here.
TIPC Ratings
Research & Information Fluency
Rating: Approaching – Explanation: Students selected the battle they wanted to research and chose which sources they wanted to use (books, posters in class, or an Internet search were all options). We guided them on efficient ways to search, but ultimately they could do it anyway they wanted. They did not come up with their own research question since we were focusing on battlefield casualties, but they did take their research and display it in a unique way to help their classmates solve an authentic problem.
Communication & Collaboration
Rating: Approaching – Explanation: Students collaborated and communicated throughout the process of deciding what to research and how to display the data effectively. Their projects were interdependent in that they had to combine their different infographics together at the end of the lesson in order to determine which battle was the greatest victory. They collaborated online when they answered each others’ questions and evaluated the responses. The students could choose the classmates with whom they wanted to collaborate.
Critical Thinking & Problem Solving
Rating: Approaching – Explanation: Students had to justify and support their position on Virginia’s greatest victory using a combination of data from their own research and their classmates’ research. It was an open-ended and authentic task utilizing their ability to estimate and compare fractions. They used digital tools to research, create, display, and solve their problem.
Creativity & Innovation
Rating: Approaching – Explanation: Students combined their mathematical knowledge of fractions with their historical understanding of the battles to create an original infographic that was used in combination with their classmate’s infographics to solve the authentic task of determining Virginia’s greatest victory. They chose how to display their data using the fonts, colors, icons, and chart properties that they wanted to use. Although they were limited by the requirement of using Piktochart, since this was their first time using it, they were given creative freedom within the scope of using that tool.

