Summary
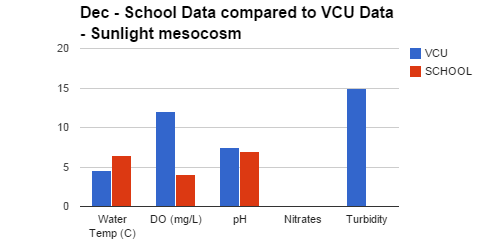
A mesocosm is an artificial body of water used for testing and gathering experimental data.Throughout this lesson, the students will conduct investigations of water quality. Data will be collected and recorded both in the field and in the lab setting. Class results will be shared via a class collaborative Google spreadsheet and with the World Water Monitoring Organization (WWWO). Arithmetic calculations are used in data analysis; conclusions are formed based on recorded quantitative and qualitative data; and comparisons will be made between the School and VCU mesocosms. Appropriate technology including computers, Skype, and probeware, are used for gathering and analyzing data and communicating results.
TIPC Ratings
Target – Students conducted field research on Mesocosms including: what are they, why they are used, when are they appropriate, and where are they located. When collecting data, they used probeware for temperature and WWWO kits including tablets for the disolved oxygen. Students had to learn how to collect data accurately, so the tests could be replicated. They did research on the internet, and using scientific literature published by VCU and the department of environmental studies.They also Skyped with Anne Wright a professor at VCU and asked her questions. Link to photos of students collecting data/samples.
Target – Students worked in groups of 3-4 to do the water testing and when creating the charts and presentations of the data. There was class collaboration on the google spreadsheet for class data. Students also used a collaborative google spreadsheet to display and analyze their data and they created presentations using Google Slides.This project was also based on the annual World Water Monitoring Organization (WWWO) challenge. The average of students data is entered on the WWWO website for the world to see. Collaboration also extended beyond the classroom by Skyping with an expert Professor Anne Wright. Link to school data on WWWO website.
Approaching – Students had to analyze the data from the water samples and they had to determine what environmental factors affected each test result.They had to compare and contrast data from different mesocosm sites (sun/shade/etc.) They had to think deeply to ask questions of the expert during the Skype session. They had to understand how photosynthesis and respiration affected the amount of oxygen and dissolved carbon dioxide in the water. Additionally, they had to justify and explain why the results varied depending on the environmental factors. When they analyzed the class data, they had to recognize outliers and occasionally throw out invalid data. Students reflected on their results and charts within the spreadsheet.
Link to Student Artifact – Google Spreadsheet with data, charts, and comparison to VCU.
Developing – With each change of season, the students analyzed trends and made predictions how the change in temperature would affect the mesocosm. The students also decorated the mesocosm for holidays depending on the season. Creating the landscape, bricks, kiosk, display, and sign were also part of an Eagle scout project.


