Summary
President Obama has asked us to help him with the budget for the Federal Government for the year 2013. Though our many SchoolSpace discussion boards, you have become aware of some of the issues that need to be considered (ex. Unemployment, National Debt, and Opposing Philosophies). The President needs to design a budget that will be agreeable to both the Senate and the House. The budget must be designed to restore confidence in our economy, help the unemployment rate to go down, and address our nation’s debt.
During this lesson, students will examine real world data to see where we are today with the national debt and US federal tax revenues. Students will decide on a position to either increase taxes or reduce spending. Their personal views are the foundation of how they will decide their budget choices.
Google Drive will be used extensively throughout this lesson. Directions are provided via Google Documents and students will be creating Google spreadsheets. Then, groups of students will create a web-based presentation. They will include a scatterplot of spending based on real US data, an equation to model the data, a prediction as to what the budget will look like by the year 2020, recommendations for the budget, and they will justify their decisions based on their position. There is also a self-reflection at the conclusion of the lesson.
TIPC Ratings
Before beginning the Federal Government lesson, the teacher modeled the mathematics with a prior lesson called Gabe’s Budget. She scaffolded the learning process by using an example with a teenager with a job and small income. Gave had to budget his money for a car, clothes, food, and entertainment. He had a goal to save enough money to move out of his parents house by graduation. Students had to analyze data and determine where to cut/increase spending in order to reach this goal.
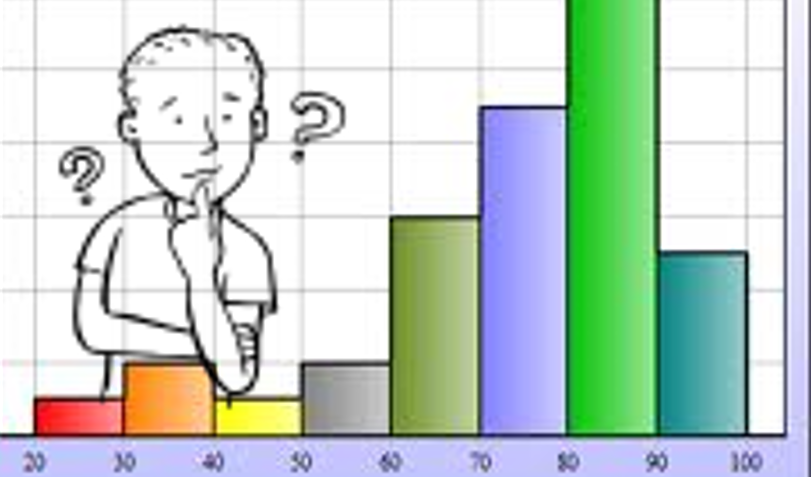
Students began the Federal Government Budget unit by reading discussion boards shared within the class. Example Discussion Board prompt where students were asked to analyze any trends they saw and debt over time. They had to make observations about the graph (examples: what do you notice? why do you think? why did debt increase so much between 1940-1950?) Additionally, students had to explain why they thought the trend may be occurring. They discussed some of the issues that need to be considered such as unemployment, spending versus revenue, and philosophies on taxes.This rubric was used to assess the Discussion Board threads for content, comments, and contributions.
The teacher also shared a Rubric with the students regarding how the final project would be graded.
A class collaborative document called Questions about Government Spending was used by the students to make a list of questions that they would want the answers to so that they could help President Obama create a passable budget. Their questions were designed so that they collect information about where the government’s finances in general. The questions were to begin with a variety of prompts based on Bloom’s Taxonomy. Each group typed questions and then the other groups had to read the questions & choose a favorite question.
For students to make informed decisions about what to cut or spend money on, they used this Outline of Budgeted items to read/research about all of the budget items. The students had to analyze and synthesize information from a variety of sources including a US Government Spending spreadsheet. They had to use this information to form an opinion regarding their view of the national debt. And, students had to use this information as a foundation of how they made their government spending and budget choices. This entire task was built on current US data. The students also had to choose from a variety of digital tools to evaluate the information which is explained further in the Critical Thinking section.
Students communicated and collaborated using a variety of digital tools. Early on, they participated in SchoolSpace discussion boards where they analyzing graphs that had to do with government spending. For example, how is unemployment affected by the US Federal Budget. The students also communicated using a class collaborative document called Questions about Government Spending to make a list of questions that they would want the answers to so that they could help President Obama create a passable budget.
The teacher shared the lesson and all resources using Google Drive. Students formed teams of four and created scatterplots using Google Spreadsheets and Charts. They also created collaborative Presentations in Google. Students had to decide as a team who was going to work on each topic. They proofed and edited each others work. Students had to come together as a team to summarize their budget for the four total categories. With the Google Drive products they were able to work together even though they were at home.
There were many strategies used to solve this complex open-ended problem. Early on, students read the discussion boards and information on the websites, and they began to self generate questions.
Students had to analyze many resources to form their opinion regarding their view of the national debt. They had to investigate at least four areas of government spending. Students looked at the data from the US Government Spending spreadsheet and recorded the data for their particular area that they chose (ex. health care). From that they created the scatter plot using Google Spreadsheets and charts/graphs for each department of government spending. They had analyze the graph to determine, the best model for the equation for that data – was it linear, quadratic, exponential. And, they had to determine the best equation to model the data. These are not only difficult tasks for these students, they are especially challenging when using real world data.
Students then had to take the data and enter it in a graphing calculator. The calculator determined the curve of best fit – which is an equation. Students had to know how to press the correct buttons on the calculator for linear, quadratic, or an exponential function. The calculator tells what A, B, and C are and the students had to come up with the correct equation.
Based on their analysis, students had to provide recommendations for the budget for each department. And, they had to summarize their calculations by providing totals for money saved or spend. The students also made predictions as to what the budget would look like by the year 2020 using the equations that they created.
Students had to use the highest level of Blooms to evaluate the national debt situation and determine their stance on higher taxes or reduce spending. Additionally, students completed a self reflection of their learning experience at the conclusion of the activity. Students were making connections that whether the situation was linear, quadratic, or exponential – we can use math to represent any aspect of life.
Students used a variety of skills to analyze data, made recommendations, summarize their calculations, make a prediction based on trends, and make decisions based on their findings. They also created self generated questions based on Blooms for topics that they would need to find answers to during their research. They each displayed this information with a unique solution. They used many digital resources and graphing calculators. Lastly, they completed a personal self reflection (student responses to self reflection) of their experience.
Students also made a prediction about what would happen in the year 2020. They had to determine that this was 81 years from the starting point because their data did not start at year 0 (it was 1940). Along with their prediction, they had to decide what should be done (ex. cut spending) and write a few sentences about their decision. Each group of 4 analyzed 4 different areas of government spending. Finally, they wrote a summary of all of the groups decisions based on the data and what they would cut or raise.
Student Artifact

Download Files

- H21 Lesson Plan
- Discussion Board Prompt
- Discussion Board Rubric
- Questions-Gov’t Spending
- US Govt Spending Spreadsheet
- Outline of Budgeted Items
- Rubric Federal Budget
- Student Personal Reflection
- Student Artifact1
- Student Artifact2